I have been working on a project where we have to store application data (clicks, views, mentions,…etc) in order to do some analytics later on on the data. There are several ways to architect a solution for this kind of problem and although in the past I architected a similar solution to this problem using Apache Kafka and the Citus extension for PostgreSQL this time we decided to use an in-memory storage engine and implement a batch job that regularly aggregates the data and stores it in PostgreSQL.
The question was which in-memory storage engine should we go for? In this post, I will compare three promising tools and do some performance testing on them in order to better evaluate which one to go with. Before I start I have to mention that I am slightly biased towards Redis because I have used it regularly in the past and know my way around it but after having now worked with both Aerospike and Tarantool I have to say that all of them are worthy candidates.
Test Setup
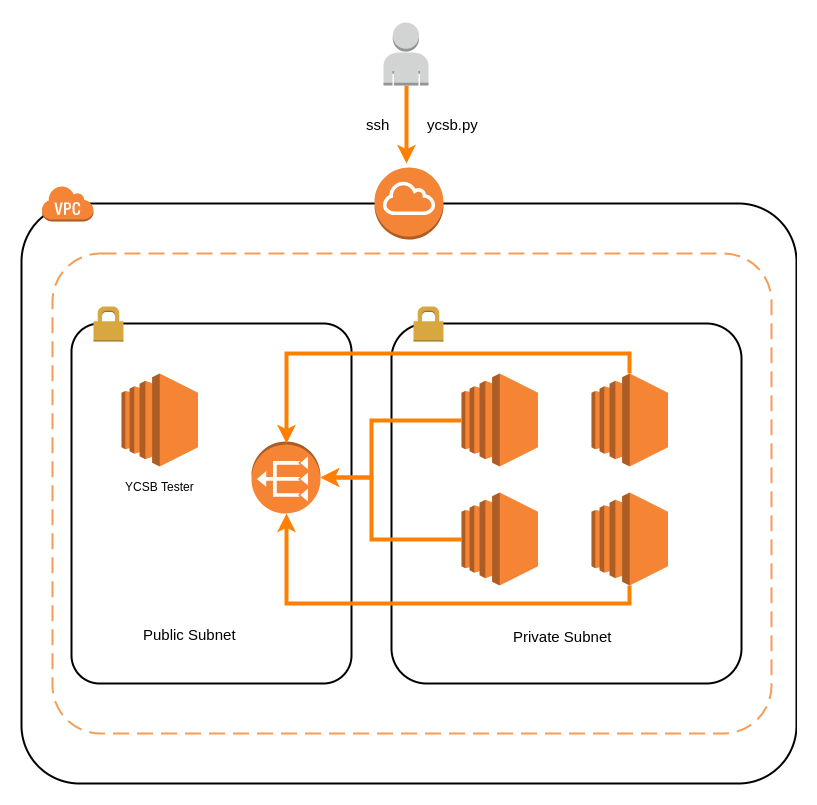
The tests are run on AWS. I use terraform to provision the infrastructure. The picture below shows an overview of the infrastructure. The tools were provisioned as single instances on their own nodes:
YCSB-tester on a c4.2xlarge (This instance was used to run YCSB tool to perform the tests)
Redis-tester(v. 4.0.6) on a m4.xlarge
Tarantool-tester(v. 1.8) on a m4.xlarge
Aerospike-tester(v. 3.15.0.1) on a m4.xlarge
Elasticache-tester(v. 3.2.4) on a cache.m4.xlarge
YCSB
Yahoo! Cloud Serving Benchmark, or YCSB is a powerful utility for performance measuring of a wide range of databases. It is the de facto tool for benchmarking databases and that’s why I use it here for my tests.
YCSB provides few core workload types that are presented in its own directory as configuration files. There are six major workload types named by letters from A to F.
Workload A is an update-heavy workload. It has a mix of 50/50 reads and writes. An application example is a session store recording recent actions.
Workload B is primarily a read workload. It has a 95/5 read/write mix. Application example: photo tagging; add a tag is an update, but most operations just read tags.
Workload C is 100% read. Application example: user profile cache, where profiles are constructed elsewhere (e.g., Hadoop).
Workload D, new records are inserted and the most recently inserted records are the most popular. Application example: user status updates; people want to read the latest news.
Workload E, short ranges of records are queried instead of individual records. Application example: threaded conversations, where each scan is for the posts in a given thread (assumed to be clustered by thread id).
Workload F, the client will read a record, modify it, and write back the changes. Application example: user database, where user records are read and modified by the user or to record user activity.
On top of the core workloads configurations, YCSB was configured to use 2000000 record counts, 5000000 operation counts, and 100 threads.
Configuration considerations
Tarantool and Aerospike were configured to use only their respective in-memory storages. Log level was set to INFO and wasn’t disabled because I wanted a realistic production comparison. As mentioned before single instances of the tools were run although redis, tarantool and aerospike are capable of being run as multiple instances on the same node (Elasticache?). Another way to push tarantools and aerospike performance would be to attach multiple NICs to the nodes, I didn’t do this in my tests and I didn’t perform any performance tweaks such as IRQ affinity and process affinity.
Since networking will be a real bottleneck in the tests sometimes the tests are run on the tool instances to circumvent the network. However, we don’t plan on running our App on the same server as the in-memory DB but rather in the same VPC. In order to mimic the production setup as best as possible, we decided on placing the YCSB test tool on a sperate instance in a public subnet and the in-memory DBs in a private subnet.
Performing the tests
As mentioned earlier, the code is located on GitHub. If you want to perform the tests yourself you would initiate the infrastructure with the terraform scripts in the infrastructure/ directory. Terraform will ask you for your public IP, it needs the public IP because of the security group, it will add a security group that allows ingress connections to port 22(SSH) and port 2375 (docker) only from the IP you specify.
After terraform has completed the provisioning the infrastructure it will output a message similar to this:
Apply complete! Resources: 19 added, 0 changed, 0 destroyed.

Outputs:

Aerospike-tester = 10.0.16.11
Elasticache-tester = elasticache-ycsb.jkzj1v.0001.euw1.cache.amazonaws.com
Redis-tester = 10.0.16.8
Tarantool-tester = 10.0.16.9
YCSB-tester = 54.171.25.21
Use the IPs from the output to update the ycsb_conf.dat file.
Afterwards, you can run the tests by running:
python ycsb.py run --html=True --stdout=True --config_file='ycsb_conf.dat' --docker_host='tcp://54.171.25.21:2375'
The python script will execute remote docker API calls so that you don’t have to ssh into the YCSB-tester node and do it yourself. It will also output the results to your terminal and write a report HTML file.
After the python script has completed and the results are obtained you can get rid of the infrastructure by running terraform destroy in the infrastructure/ directory.
Results
The results are slightly surprising. It seems either Redis can’t deal with more than roughly 100 threads or the Redis JAVA client included with YCSB has some problems. The results for 100 threads can be seen here and the results for 256 threads here.
We can see that Aerospike and Tarantool are both faster than Redis for Inserts. For workload B, C.. there are no INSERT results because we get those only when loading the data and we only load the data once.
We can also see that the performance degrades when using 256 threads which in my opinion is surprising. After examing the nodes (CPU, Mem, I/O) I think the reason for the degradation is either the YCSB tool or the network.
Conclusions
All of the tools tested passed our requirements of <3ms ops latencies with a throughput higher than 50.000 ops/sec. In the end, the choice boils down to two things:
- Ease of use (Learning curve)
- Maintainance & Scalability
Redis is already in use in our App so the developers wouldn’t need to learn a new tool. Maintenance is also reduced thanks to AWS managed Redis (Elasticache). Scaling Redis is not as straightforward as scaling Tarantool and Aerospike. Adding nodes can be tricky and requires high knowledge of Redis architecture.
Tarantool isn’t difficult to learn either, it supports SQL commands which is awesome and it can act as a hybrid storage (mem+disk). It supports hot/standby setups and automatic sharding and resharding.
Aerospike is a hybrid DB and has its own query language which is SQL-like. It also comes with a management console and supports automatic sharding and resharding and adding new nodes can be done on a running production cluster.
For a new project, I will definitely be recommending Aerospike or Tarantool but for now the team has to decide :)